This is for people who want to understand how programs get loaded under linux. In particular it talks about dynamically loaded x86 ELF files. The information you learn will let you understand how to debug problems that occur in your program before main starts up. Everything I tell you is true, but some things will be glossed over since they don't take us toward our goal. Further, if you link statically, some of the details will be different. I won't cover that at all. By the time you're done with this though, you'll know enough to figure that out for yourself if you need to.
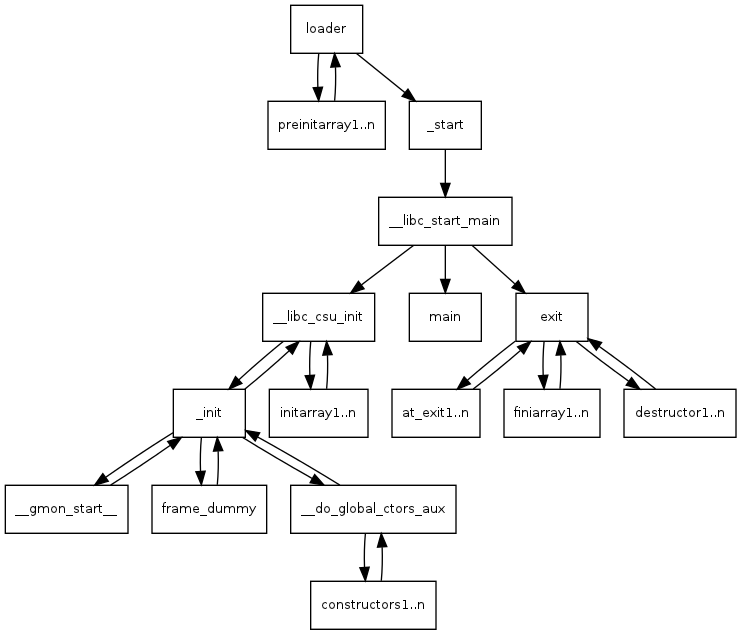
When we're done, you'll understand this.
We're going to build the simplest C program possible, an empty main, and then we're going to look at the disassembly of it to see how we get to main. We'll see that the first thing that's run is a function linked to every program named _start which eventually leads to your program's main being run.
Save a copy of this as prog1.c if you want, and follow along. The first thing I'll do is to build it like this.
Before we try to debug a later version of this (prog2), in gdb, we're going to look at the disassembly of it and learn a few things about how our program starts up. I'm going to show the output of objdump -d prog1, but I'm not going to show it in the order it would be dumped by objdump, but rather in the order it would be executed. (But you're perfectly welcome to dump it yourself. Something like objdump -d prog1 >prog1.dump will save a copy for you, and then you can use your favorite editor to look at it.) (But RPUVI - Real Programmers Use VI;) N.B. This quip originally said Real Men, because that was the humorous usage that was prevelant when I was a young programmer. Someone (thanks aroman) objected, and after thinking about it, I agreed. The current reader has no idea of the context in my head, and I am always trying to get people to see that we need a lot more women in STEM and that part of the problem is that there is a prevalent unconscious gender bias in STEM that makes it unwelcoming for women. (As mine was unconscious here.) Now we return you to the regularly scheduled tutorial.
When you run a program, the shell or gui calls execve() which executes the linux system call execve(). If you want more information about execve() then you can simply type man execve from your shell. It will come from section 2 of man where all the system calls are. To summarize, it will set up a stack for you, and push onto it argc, argv, and envp. The file descriptions 0, 1, and 2, (stdin, stdout, stderr), are left to whatever the shell set them to. The loader does much work for you setting up your relocations, and as we'll see much later, calling your preinitializers. When everything is ready, control is handed to your program by calling _start() Here from objdump -d prog1 is the section with _start.
xor of anything with itself sets it to zero. so the xor %ebp,%ebp sets %ebp to zero. This is suggested by the ABI (Application Binary Interface specification), to mark the outermost frame. Next we pop off the top of the stack. On entry we have argc, argv and envp on the stack, so the pop makes argc go into %esi. We're just going to save it and push it back on the stack in a minute. Since we popped off argc, %esp is now pointing at argv. The mov puts argv into %ecx without moving the stack pointer. Then we and the stack pointer with a mask that clears off the bottom four bits. Depending on where the stack pointer was it will move it lower, by 0 to 15 bytes. In any case it will make it aligned on an even multiple of 16 bytes. This alignment is done so that all of the stack variables are likely to be nicely aligned for memory and cache efficiency, in particular, this is required for SSE (Streaming SIMD Extensions), instructions that can work on vectors of single precision floating point simultaneously. In a particular run, the %esp was 0xbffff770 on entry to _start. After we popped argc off the stack, %esp was 0xbffff774. It moved up to a higher address (putting things on the stack moves down in memory, taking things off moves up in memory). After the and the stack pointer is back at 0xbffff770.
So now we start pushing arguments for __libc_start_main onto the stack. The first one, %eax is garbage pushed onto the stack just because 7 things are going to be pushed on the stack and they needed an 8th one to keep the 16-byte alignment. It's never used for anything. __libc_start_main is linked in from glibc. In the source tree for glibc, it lives in csu/libc-start.c. __libc_start_main is specified like
So we expect _start to push those arguments on the stack in reverse order before the call to __libc_start_main.
| value | __libc_start_main arg | content |
|---|---|---|
| $eax | Don't know. | Don't care. |
| %esp | void (*stack_end) | Our aligned stack pointer. |
| %edx | void (*rtld_fini)(void) | Destructor of dynamic linker from loader passed in %edx. Registered by __libc_start_main with __cxat_exit() to call the FINI for dynamic libraries that got loaded before us. |
| 0x8048400 | void (*fini)(void) | __libc_csu_fini - Destructor of this program. Registered by __libc_start_main with __cxat_exit(). |
| 0x80483a0 | void (*init)(void) | __libc_csu_init, Constructor of this program. Called by __libc_start_main before main. |
| %ecx | char **ubp_av | argv off of the stack. |
| %esi | arcg | argc off of the stack. |
| 0x8048394 | int(*main)(int, char**,char**) | main of our program called by __libc_start_main. Return value of main is passed to exit() which terminates our program. |
__libc_csu_fini is linked into our code from glibc, and lives in the source tree in csu/elf-init.c. It's our program's C level destructor, and I'll look at it later in the white paper.
Did you notice that we didn't get envp, the pointer to our environment variables off the stack? It's not one of the arguments to __libc_start_main, either. But we know that main is called int main(int argc, char** argv, char** envp) so what's up?
Well, __libc_start_main calls __libc_init_first, who immediately uses secret inside information to find the environment variables just after the terminating null of the argument vector and then sets a global variable __environ which __libc_start_main uses thereafter whenever it needs it including when it calls main. After the envp is established, then __libc_start_main uses the same trick and surprise! Just past the terminating null at the end of the envp array, there's another vector, the ELF auxiliary vector the loader uses to pass some information to the process. An easy way to see what's in there is to set the environment variable LD_SHOW_AUXV=1 before running the program. Here's the result for our prog1.
Isn't that interesting. All sorts of information. The AT_ENTRY is the address of _start, there's our userid, our effective userid, and our groupid. We know we're a 686, times() frequency is 100, clock-ticks/s? I'll have to investigate this. The AT_PHDR is the location of the ELF program header that has information about the location of all the segments of the program in memory and about relocation entries, and anything else a loader needs to know. AT_PHENT is just the number of bytes in a header entry. We won't chase down this path just now, since we don't need that much information about the loading of a file to be an effective program debugger.
That's about as much as I'm going to get into the nitty-gritty details of how __libc_start_main, but in general, it
The init argument, to __libc_start_main, is set to __libc_csu_init which is also linked into our code. It's compiled from a C program which lives in the glibc source tree in csu/elf-init.c and linked into our program. The C code is similar to (but with a lot more #ifdefs),
It's pretty important to our program because it's our executable's constructor. "Wait!", you say, "This isn't C++!". Yes that's true, but the concept of constructors and destructors doesn't belong to C++, and preceeded C++! Our executable, and every other executable gets a C level constructor __libc_csu_init and a C level destructor, __libc_csu_fini. Inside the constructor, as you'll see, the executable will look for global C level constructors and call any that it finds. It's possible for a C program to also have these, and I'll demonstrate it before this paper is through. If it makes you more comfortable though, you can call them initializers and finalizers. Here's the assembler generated for __libc_csu_init.
Not much to talk about here, but I thought you'd want to see it. The get_pc_thunk thing is a little interesting. It's used for position independent code. They're setting up for position independent code to be able to work. In order for it to work, the base pointer needs to have the address of the GLOBAL_OFFSET_TABLE. The code had something like:
So, look closely at what happens. The call to __get_pc_thunk_bx, like all other calls, pushes onto the stack the address of the next instruction, so that when we return, the execution continues at the next consecutive instruction. In this case, what we really want is that address. So in __get_pc_thunk_bx, we copy the return address from the stack into %ebx. When we return, the next instruction adds to it _GLOBAL_OFFSET_TABLE_ which resolves to the difference between the current address and the global offset table used by position independent code. That table keeps a set of pointers to data that we want to access, and we just have to know offsets into the table. The loader fixes up the address in the table for us. There is a similar table for accessing procedures. It could be really tedious to program this way in assembler, but you can just write C or C++ and pass the -pic argument to the compiler and it will do it automagically. Seeing this code in the assembler tells you that the source code was compiled with the -pic flag.
The loop from __libc_csu_init will be discussed in a minute after we discuss the init() call that really calls _init. For now, just remember that it calls any C level initializers for our program.
Ok, the loader handed control to _start, who called __libc_start_main who called __libc_csu_init who now calls _init.
If you want to know more about the C calling convention, just look at Basic Assembler Debugging with GDB. The short story is that we save our caller's base pointer on the stack and point our base pointer at the top of the stack and then save space for a 4 byte local of some sort. An interesting thing is the first call. It's purpose is quite similar to that call to get_pc_thunk that we saw earlier. If you look closely, the call is to the next sequential address! That gets you to the next address as if you'd just continued, but with the side effect that the address is now on the stack. It gets popped into %ebx and then used to set up for access to the global access table.
Then we grab the address of gmon_start. If it's zero then we don't call it, instead we jump past it. Otherwise, we call it to set up profiling. It runs a routine to start profiling, and calls at_exit to schedule another routine to run later to write gmon.out at the end of execution.
In either case, next we call frame_dummy. The intention is to call __register_frame_info, but frame_dummy is called to set up the arguments to it. The purpose of this is to set up for unwinding stack frames for exception handling. It's interesting, but not a part of this discussion, so I'll leave it for another tutorial perhaps. (Don't be too disappointed, in our case, it doesn't get run anyway.)
Finally we call _do_global_ctors_aux. If you have a problem with your program that occurs before main starts, this is probably where you'll need to look. Of course, constructors for global C++ objects are put in here but it's possible for other things to be in here as well.
Let's modify our prog1 and make a prog2. The exciting part is the __attribute__ ((constructor)) that tells gcc that the linker should stick a pointer to this in the table used by __do_global_ctors_aux. As you can see, our fake constructor gets run. (__FUNCTION__ is filled in by the compiler with the name of the function. It's gcc magic.)
In a minute we'll drop into gdb and see it happen. We'll be going into prog2's _init.
As you can see, the addresses are slightly different than in prog1. The extra bit of data seems to have shifted things 28 bytes. So, there's the name of the two functions, "a_constructor" (14 bytes with null terminator), and "main" (5 bytes with null terminator) and the two format strings, "%s\n" (2*4 bytes with the newline as 1 character and the null terminator), so 14 + 5 + 4 + 4 = 27? Hmmm off by one somewhere. It's just a guess anyway, I didn't go and look. Anyway, we're going to break on the call to __do_global_ctors_aux, and then single step and watch what happens.
Just to help, here's the C source code for __do_global_ctors_aux out of the gcc source code where it lives in a file gcc/crtstuff.c.
As you can see, it initializes p from a global variable __CTOR_END__ and subtracts 1 from it. Remember this is pointer arithmetic though and the pointer points at a function, so in this case, that -1 backs it up one function pointer, or 4 bytes. We'll see that in the assembler as well. While the pointer doesn't have a value of -1 (cast to a pointer), we'll call the function we're pointing at, and then back the pointer up again. Obviously, the beginning of this table starts with -1, and then has some number (perhaps 0) function pointers.
Here's the assembler that corresponds to it from objdump -d. We'll go over it carefully so you understand it completely before we trace through it in the debugger.
There's the normal preamble with the addition of saving %ebx as well because we're going to use it in the function, and we also save room for the pointer p. You'll notice that even though we save room on the stack for it, we never store it there. p will instead live in %ebx, and *p will live in %eax.
It looks like an optimization has occurred, instead of loading __CTOR_END__ and then subtracting 1 from it, and dereferencing it, instead, we go ahead and load *(__CTOR_END__ - 1), which is the immediate value 0x8049f14. We load the value in it (remember $0x8049f14 would mean put that value, without the $, just 0x8049f14 means the contents of that address), into %eax. Immediately, we compare this first value with -1 and if it's equal, we're done and jump to address 0x8048474, where we clean up our stack, pop off the things we've saved on there and return.
Assuming that there's at least one thing in the function table, though, we also move the immediate value $0x8049f14, into %ebx which is f our function pointer, and then do the xchg %ax,%ax. What the heck is that? Well, grasshopper, that is what they use for a nop (No OPeration) in 16 or 32 bit x86. It does nothing but take a cycle and some space. In this case, it's used to make the loop (the top of the loop is the subtract on the next line) start on 8048468 instead of 8048466. The advantage of that is that it aligns the start of the loop on a 4 byte boundary and gives a better chance that the whole loop will fit in a cache line instead of being broken across two. It speeds things up.
Next we subtract 4 from %ebx to be ready for the next time through the loop, call the function we've got the address of in %eax, move the next function pointer into %eax, and compare it to -1. If it's not -1 we jump back up to the subtract and loop again.
Otherwise we fall through into our function epilogue and return to _init, which immediately falls through into its epilogue and returns to __libc_csu_init__. Bet you forgot all about him. There's still a loop to deal with there but first--
So here we go! Remember that gdb always shows you the line or instruction that you are about to execute.
We ran it in the debugger, turned disassemble-next-line on, so that it will always show us the disassembly for the line of code that is about to be executed, and set a breakpoint at the line in _init where we're about to call __do_global_ctors_aux.
I typed r to run the program and hit the breakpoint. My next command to gdb was si, step instruction, to tell gdb to single step one instruction. We've now entered __do_global_ctors_aux. As we go along you'll see times when it seems that I entered no command to gdb. That's because, if you simply press return, gdb will repeat the last instruction. So if I press enter now, I'll do another si.
Ok, now we've finished the preamble, and the real code is about to start.
I was curious after loading the pointer so I told gdb p/x $eax which means print as hexadecimal the contents of the register %eax. It's not -1, so we can assume that we'll continue through the loop. Now, since my last command was the print, I can't hit enter to get an si, I'll have to type it the next time.
Now this is very interesting. We've single stepped into the call. Now we're in our function, a_constructor. Since gdb has the source code for it, it shows us the C source for the next line. Since I turned on disassemble-next-line, it will also give us the assembler that corresponds to that line. In this case, it's the preamble for the function that corresponds to the declaration of the function, so we get all three lines of the preamble. Isn't that interesting? Now I'm going to switch over to the command n (for next) because our printf is coming up. The first n will skip the preamble, the second the printf, and the third the epilogue. If you've ever wondered why you have to do an extra step at the beginning and end of a function when single stepping with gdb, now you know the answer.
We moved the address of the string "a_constructor" onto the stack as an argument for printf, but it calls puts since the compiler was smart enough to see that puts was all we needed.
Since we're tracing the program, it is, of course running, so we see a_constructor print out above. The closing brace (}) corresponds to the epilogue so that prints out now. Just a note, if you don't know about the instruction leave it does exactly the same as
One more step and we exit the function and return, I'll have to switch back to si.
Got curious and checked again. This time, our function pointer is -1, so we'll exit the loop.
Notice we're back in _init now.
Notice we jumped back up into __libc_csu_init, and that's when I typed q to quite the debugger. That's all the debugging I promised you. Now that we're back in __libc_csu_init__ there's another loop to deal with, and I'm not going to step through it, but I am about to talk about it.
Since we've spent a long tedious time dealing with a loop in assembler and the assembler for this one is even more tedious, I'll leave it to you to figure it out if you want. Just to remind you, here it is in C.
What is this __init_array? I thought you'd never ask. You can have code run at this stage as well. Since this is just after returning from running _init which ran our constructors, that means anything in this array will run after constructors are done. You can tell the compiler you want a function to run at this phase. The function will receive the same arguments as main.
We won't do it, yet, because there's more things like that. Lets just return from __lib_csu_init. Do you remember where that will take us?
He calls our main now, and then passes the result to exit().
exit() runs the functions registered with at_exit run in the order they were added. Then he runs another loop of functions, this time, functions in the fini array. After that he runs another loop of functions, this time destructors. (In reality, he's in a nested loop dealing with an array of lists of functions, but trust me this is the order they come out in.) Here, I'll show you.
If you build and run this, (I call it hooks.c), the output is
I'll give you a last look at how far we've come. This time it should all be familiar territory to you.